
In 2024, a total of 3,628,934 babies were born in the United States. While most pregnancies progress without major complications, hundreds of thousands of families face deliveries that carry a higher-than-normal risk. Factors such as preterm birth, low birth weight, and delayed prenatal care can signal a higher-risk pregnancy or delivery and may lead to lifelong consequences for both mothers and babies, while C-section rates can reflect delivery complexity but may also represent appropriate and necessary care.
Maternal and infant health have improved significantly over time, but these complications remain all too frequent. That said, pregnancy outcomes are not uniform across the country, and certain regions report noticeably higher rates of high-risk births than other regions.
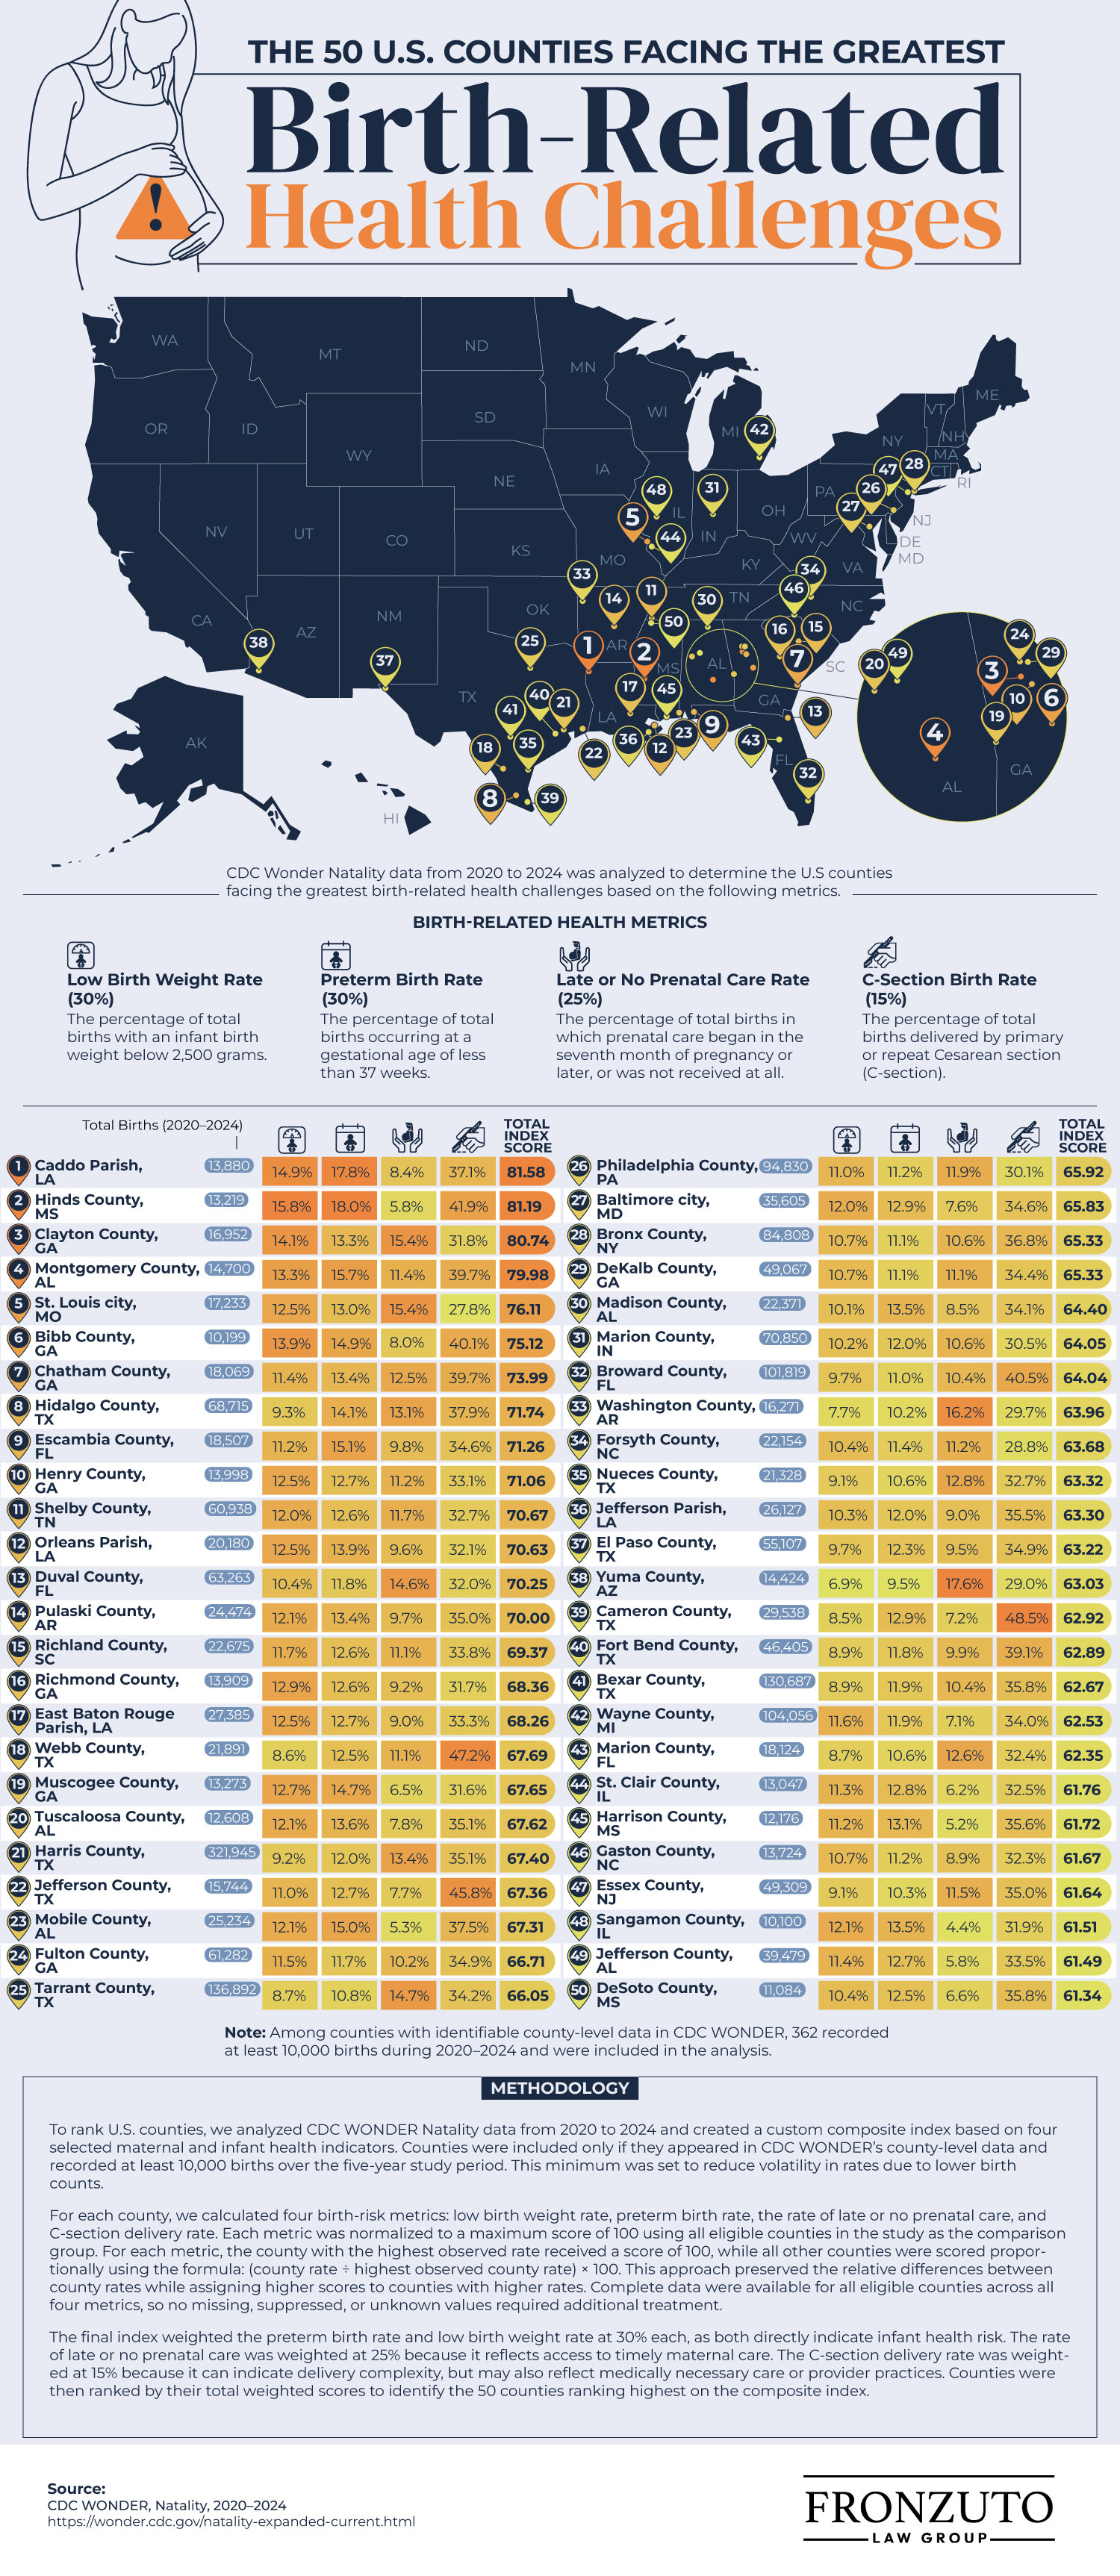
Fronzuto Law Group analyzed CDC WONDER natality data from 2020 through 2024 to create a custom composite index of selected maternal and infant health indicators and identify the U.S. counties facing the greatest birth-related health challenges, as well as assess how New Jersey compares.
Embed the U.S. infographic on your site
<a href="https://www.fronzutolaw.com/research-studies/the-50-us-counties-facing-the-greatest-birth-related-health-challenges/">
  <img src="https://cdn.sanity.io/images/rb7md42j/production/d64cac651b1c3018feb275a699f1de603aa7fdec-1500x3451.png" alt="The 50 U.S. Counties Facing the Greatest Birth-Related Health Challenges - Fronzuto Law Group Birth Injury Litigation - Infographic" title="The 50 U.S. Counties Facing the Greatest Birth-Related Health Challenges - FronzutoLaw.com - Infographic">
</a>
<br>
<a href="https://www.fronzutolaw.com" title="FronzutoLaw.com">By FronzutoLaw.com</a>
What Factors Contribute to Birth-Related Health Risks?
High-risk births are pregnancies and deliveries with an increased likelihood of complications before, during, or after birth. For our analysis, we focused specifically on the metrics of low birth weight, preterm birth, late or no prenatal care, and C-section birth rates, and we weighted each complication based on its risk to the infant.
Low birth weight, defined as an infant weighing under 2,500 grams, and preterm birth, which is delivery before 37 weeks of gestation, are both direct indicators of infant health, and each contributed 30% to a county’s final score. Late or no prenatal care was weighted at 25% because it indicates whether a mother received adequate medical monitoring throughout pregnancy, which can help identify complications before birth. The C-section rate, weighted at 15%, can indicate higher-risk pregnancies or fetal distress during delivery, but it may also reflect physician recommendations or patient-specific medical needs, so it received a smaller weighting in the final index.
Where Birth-Related Health Challenges Are Greatest
In 2024, the average low-birth-weight rate was 8.52%, and preterm births accounted for 10.4% of deliveries. Approximately 7.3% of mothers received late or no prenatal care, and 32.4% of births were delivered by C-section. Counties that rank high in our analysis tend to exceed several of these figures at once.
The Southern U.S. states account for the largest share of the nation’s highest-ranked counties, with 19 of the top 20. Within the top 20, Georgia appears most frequently, followed by Louisiana. Caddo Parish, Louisiana, tops the list with an index score of 81.58, driven by a preterm birth rate of 17.8% and a C-section rate above 37%. Hinds County, Mississippi, follows closely with a score of 81.19, marked by an alarming preterm birth rate of 18% and a C-section rate of 41.9%. Clayton County, Georgia, and Montgomery County, Alabama, take the third and fourth spots, with St. Louis city, Missouri, rounding out the top five.
Yuma County, Arizona, and Washington County, Arkansas, have exceptionally high rates of delayed or nonexistent prenatal care, at 17.6% and 16.2%, respectively.
However, several top-ranked counties, including St. Louis city, Shelby County, Philadelphia County, and Bronx County, are major urban centers that also have high rates of late or no prenatal care. The common thread among these communities is not solely geographic; it is also tied to economic conditions and a shortage of local obstetric providers.
For rural mothers, limited access to nearby obstetricians is linked to more missed appointments, and even urban areas are experiencing a loss of obstetric services. This inconsistency in care throughout pregnancy makes it difficult to identify and manage potential complications, ultimately leading to higher rates of severe outcomes, such as preterm births. Additionally, low-income mothers are at a higher risk for complex pregnancies and deliveries, influenced by difficult working conditions, limited access to care, and other environmental factors.
How New Jersey Compares
Although New Jersey performs near the national average on certain maternal and infant health measures, the state continues to experience substantial racial and geographic disparities.
Embed the New Jersey infographic on your site
<a href="https://www.fronzutolaw.com/research-studies/the-50-us-counties-facing-the-greatest-birth-related-health-challenges/">
  <img src="https://cdn.sanity.io/images/rb7md42j/production/0f412199e20ca648b7cae4ddb1c966acee4e9df8-1501x2370.png" alt="The New Jersey Counties Facing the Greatest Birth-Related Health Challenges - Fronzuto Law Group Birth Injury Litigation - Infographic" title="The New Jersey Counties Facing the Greatest Birth-Related Health Challenges - FronzutoLaw.com - Infographic">
</a>
<br>
<a href="https://www.fronzutolaw.com" title="FronzutoLaw.com">By FronzutoLaw.com</a>
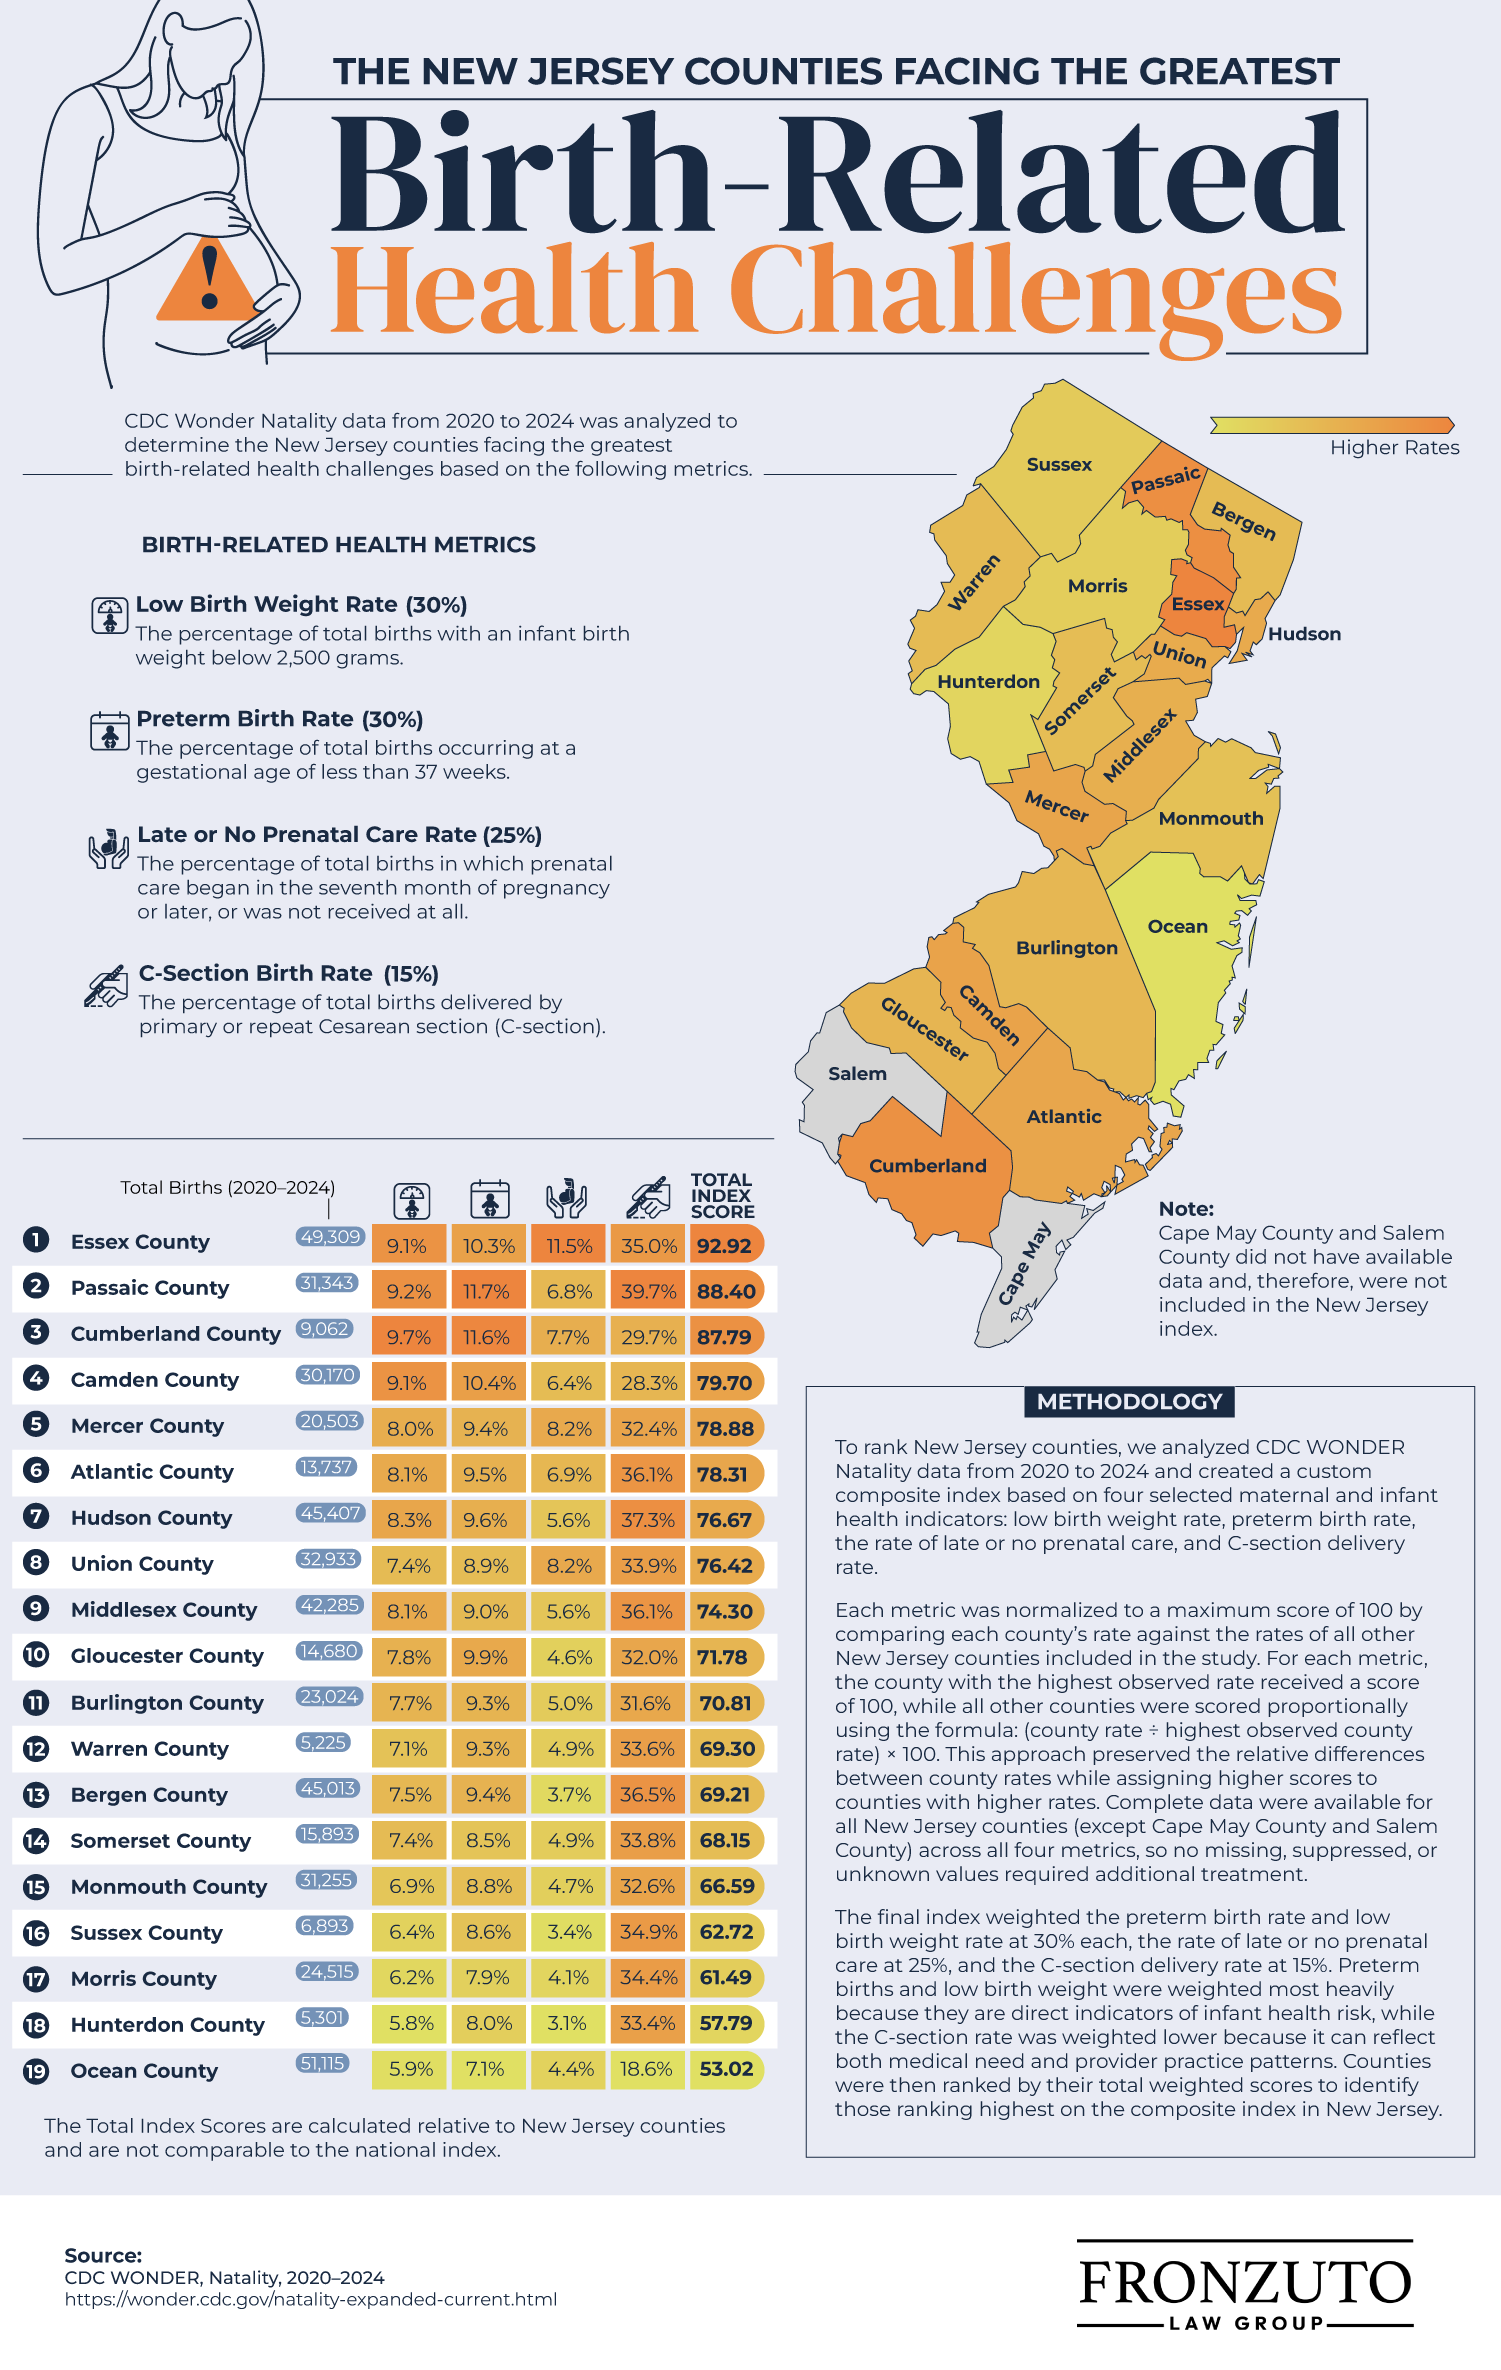
Essex County, home to Newark, ranks highest in the state and 47th nationally, with a national index score of 61.64. Essex County’s state-level index score is 92.92, far exceeding Ocean County’s score of 53.02, the lowest in the state. Passaic County has the second-highest index score in New Jersey, with a staggering 39.7% C-section rate. Cumberland County ranks third, and Camden and Mercer counties complete the top five for the state.
Similar to the national findings, New Jersey’s rankings reflect the same differences in demographics, healthcare access, and economic disparities. Essex and Passaic counties are densely populated urban centers, while Cumberland and Essex counties are among those with the highest poverty rates in the state.
High-risk births remain an important public health issue across the United States, with substantial variation from one county to another. However, it’s essential to remember that statistics do not determine the outcome of any individual pregnancy. Many high-risk pregnancies result in healthy deliveries thanks to careful monitoring, timely medical intervention, and appropriate prenatal care.
Conversely, when accepted medical standards are not followed, preventable birth injuries can occur, with lifelong consequences for children and their families. If you suspect medical negligence contributed to a birth injury, you are not alone. The lawyers at Fronzuto Law Group have helped many families navigate the complexities of birth injury litigation and secure the compensation they deserve. Contact Fronzuto Law today to discuss your situation and learn how we can help protect your family’s future.
Birth-Related Health Index Rankings for U.S. Counties
Methodology
To rank U.S. counties, we analyzed CDC WONDER Natality data from 2020 to 2024 and created a custom composite index based on four selected maternal and infant health indicators. Counties were included only if they appeared in CDC WONDER’s county-level data and recorded at least 10,000 births over the five-year study period. This minimum was set to reduce volatility in rates due to lower birth counts.
For each county, we calculated four birth-risk metrics: low birth weight rate, preterm birth rate, the rate of late or no prenatal care, and C-section delivery rate. Each metric was normalized to a maximum score of 100 using all eligible counties in the study as the comparison group. For each metric, the county with the highest observed rate received a score of 100, while all other counties were scored proportionally using the formula: (county rate ÷ highest observed county rate) × 100. This approach preserved the relative differences between county rates while assigning higher scores to counties with higher rates. Complete data were available for all eligible counties across all four metrics, so no missing, suppressed, or unknown values required additional treatment.
The final index weighted the preterm birth rate and low birth weight rate at 30% each, as both directly indicate infant health risk. The rate of late or no prenatal care was weighted at 25% because it reflects access to timely maternal care. The C-section delivery rate was weighted at 15% because it can indicate delivery complexity, but may also reflect medically necessary care or provider practices. Counties were then ranked by their total weighted scores to identify the 50 counties ranking highest on the composite index.
High-Risk Birth Metrics
- Low Birth Weight Rate (30%) — The percentage of total births with an infant birth weight below 2,500 grams.
- Preterm Birth Rate (30%) — The percentage of total births occurring at a gestational age of less than 37 weeks.
- Late or No Prenatal Care Rate (25%) — The percentage of total births in which prenatal care began in the seventh month of pregnancy or later, or was not received at all.
- C-Section Birth Rate (15%) — The percentage of total births delivered by primary or repeat Cesarean section (C-section).
Note: Among counties with identifiable county-level data in CDC WONDER, 362 recorded at least 10,000 births during 2020–2024 and were included in the analysis.
Birth-Related Health Index Rankings for New Jersey Counties
Methodology
To rank New Jersey counties, we analyzed CDC WONDER Natality data from 2020 to 2024 and created a custom composite index based on four selected maternal and infant health indicators: low birth weight rate, preterm birth rate, the rate of late or no prenatal care, and C-section delivery rate.
Each metric was normalized to a maximum score of 100 by comparing each county’s rate against the rates of all other New Jersey counties included in the study. For each metric, the county with the highest observed rate received a score of 100, while all other counties were scored proportionally using the formula: (county rate ÷ highest observed county rate) × 100. This approach preserved the relative differences between county rates while assigning higher scores to counties with higher rates. Complete data were available for all New Jersey counties (except Cape May County and Salem County) across all four metrics, so no missing, suppressed, or unknown values required additional treatment.
The final index weighted the preterm birth rate and low birth weight rate at 30% each, the rate of late or no prenatal care at 25%, and the C-section delivery rate at 15%. Preterm births and low birth weight were weighted most heavily because they are direct indicators of infant health risk, while the C-section rate was weighted lower because it can reflect both medical need and provider practice patterns. Counties were then ranked by their total weighted scores to identify those ranking highest on the composite index in New Jersey.
High-Risk Birth Metrics
- Low Birth Weight Rate (30%) — The percentage of total births with an infant birth weight below 2,500 grams.
- Preterm Birth Rate (30%) — The percentage of total births occurring at a gestational age of less than 37 weeks.
- Late or No Prenatal Care Rate (25%) — The percentage of total births in which prenatal care began in the seventh month of pregnancy or later, or was not received at all.
- C-Section Birth Rate (15%) — The percentage of total births delivered by primary or repeat Cesarean section (C-section).
Note: Cape May County and Salem County did not have available data and, therefore, were not included in the New Jersey index.